Making Pelikan fly on Arm: Diving deeper into our adventures with Tau T2A VMs
Discover how Momento tripled throughput on Google's Arm-based VMs with simple optimizations and zero code changes.
When we say we’re the world’s fastest cache, we mean it holistically. From getting started to delivering results, we strive for fast—faster scaling, faster iteration, faster time to market. In this blog, we’re focusing on two key pieces of making fast happen: developer productivity and consistent tail latencies.
Momento Cache is open-core, built on Pelikan—the open sourced caching engine summarizing Twitter’s cache best practices. Pelikan has production mileage at Twitter scale, and has had the benefit of collaboration with top research institutions. Pelikan was recently rewritten entirely in Rust, adding multi-worker support, additional protocols for both data plane and control plane, and achieving excellent TLS performance. We employed the Rust version, which is recommended for production usage.
We work closely with the Twitter Pelikan team to tune our engine, optimizing configurations, and making it work on the best possible VMs for cost:performance. This yields a highly available, scalable, and performant experience to our customers without any tuning or configurations.
As a follow-up to our high-level thoughts about tuning Pelikan for Google’s Arm-based T2A VMs, this blog dives deeper into the specific optimizations we made. It’s worth noting that the approach here embraces what we outlined in another post: 4 tips on building high-performance systems.
Read on for the full results and methodology, but some high level takeaways are:
- We were able to reach 340K requests per second (RPS) on a 2ms p999 service-level objective (SLO) on a single T2A-standard-16 VM out of the box without any tuning.
- With simple systems tuning (core pinning), we tripled our throughput and exceeded a million OPS on our 2ms p999 SLO. This tuning yielded similar improvements on x86 architecture.
Tuning Pelikan for Arm on Google Cloud’s Tau T2A VMs
We were pleasantly surprised with our efforts of tuning Pelikan on T2A VMs. Zero changes were needed to make it work. We just made some simple optimizations to quickly triple the throughput—without any code tweaks.
Test setup
We have an SLO of 2ms @p999 client side latencies for Pelikan—and our objective was to maximize throughput we could handle before breaching the SLO. This throughput is critical because it indicates our tolerance to hot keys or hot shards. Hot keys and shards are a notorious problem for caches as popular items can be requested orders of magnitude more than the average item. Furthermore, the throughput we can drive from a VM without breaching SLO helps us optimize costs on behalf of our customers.
We used 260 byte items (4 byte key, 256 byte values) with 80:20 read:write ratio and a total of 1,024 connections—across 4 rpc-perf VMs (T2A-Standard-48)—to drive concurrency. We grew the load in the increments of 10K OPS to find the throughput we could sustain without breaching our SLO.
rpc-perf and Pelikan configurations
rpc-perf
[general]
protocol = "memcache"
service = true
threads = 256
admin = "0.0.0.0:9090"

[target]
endpoints = [...] # list of IP:PORT for each endpoint

[request]
ratelimit = "2500" # rate was increased using admin port

[[keyspace]]
commands = [
  { verb = "get", weight = 8 }, # 80% read
  { verb = "set", weight = 2 }, # 20% write
 ]
 length = 4 # 4 byte keys
 values = [ { length = 256 } ] # 256 byte values
Pelikan
[admin]
host = "0.0.0.0"
port = "9999" # note: different port numbers were used for each instance

[server]
host = "0.0.0.0"
port = "12321" # note: different port numbers were used for each instance


[worker]

threads = 5

[seg]
hash_power = 24
heap_size = 25769803776
segment_size = 1048576
eviction = "Fifo"
Our setup has 2 Pelikan processes per VM. We configured each Pelikan process to have 5 worker threads that handle I/O, request parsing, etc. Each process also has a dedicated storage thread that handles all key-value access. Modern computer architecture can deliver many millions of accesses per second per channel for the type of key-values we store in DRAM, which is why we pair multiple worker threads handling network IO for each storage thread. Serializing all memory access simplifies storage code, greatly reduces the chance of data corruption, and all but eliminates nasty data races.
Pre-tuned numbers on T2A VMs
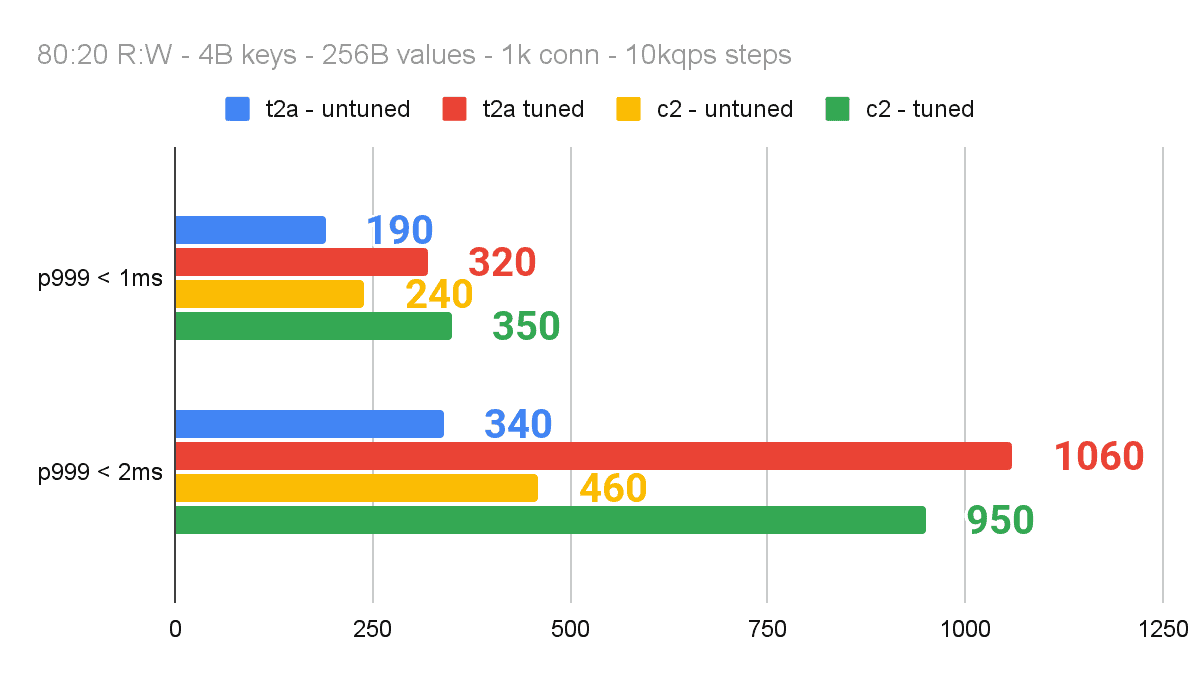
Without any tuning, we were able to drive 340K OPS within our 2ms p999 SLO on a t2A-standard-16 VM. Similarly, the x86-based C2 VMs (C2-Standard-16) drove 460K OPS within our SLO. This was great! We proceeded with some simple systems tuning (no code changes) to make things faster.
Some context on context switching
Nothing ruins performance faster than context switching! Consider this simple exercise: First, iterate A-Z in your head as fast as you can. Second, count from 1-26. Then, try doing A1, B2, C3, D4, and so on. You will notice that the third step is noticeably slower than the sum of steps 1 and 2. While our brains would adapt if we kept exercising number 3 (mostly by caching the position of each letter in the alphabet), the real world has a lot more nondeterminism and our VM processors will continue doing expensive context switches to handle these two very different tasks.
The performance of a distributed cache is typically dominated by time spent in the kernel space. There’s two types of syscalls: event handling and socket I/O. We understand that socket I/O is data heavy, consisting of memory accesses, and happening alongside packet processing to get data into socket buffers. The kernel has to move data on both fronts, which creates contention. Finally, under high load driven by a multi-threaded process or multiple processes, the overhead of context switching can be high—and gets worse if there is core or CPU migration.
Hypothesis 1: Isolating network threads to specific cores would reduce context switching and increase throughput.
Packet processing—which is invisible to the application—is handled by a set of soft IRQ handlers that run in kernel space. The kernel threads have higher priority—and kernels typically have no qualms about involuntary context switching of user space threads to handle the incoming signals in a timely fashion.
Hypothesis 2: The impact of isolation would be more prominent at higher loads
At low loads, the kernel can do a pretty good job of leaving its own threads or the user space thread of the cache process intact. To say it in a different way, if lots of cores are available, there is no need to move threads across cores or context switches to get service. On the other hand, at high loads, there is more contention—and to handle packets in a timely fashion, the kernel may be forced to thrash the threads between cores, which gets expensive.
Hypothesis 3: Tail latencies are more sensitive to infrequent context switches—and would benefit more than p50.
Even at high load, some requests may never experience any interruptions. As such, the impact may not be as visible at p50 or average latencies. If one was optimizing for only average or p50 latencies, they may never prioritize this work due to the modest gains. On the other hand, as we discussed earlier, these latencies matter—and deserve more credit.
Making Pelikan fly with core pinning
Our initial tuning for Pelikan focused primarily on reducing the number of involuntary context switches—both for the Pelikan threads and for the packet processing. Our simple approach is described in the three-step process below.
Understand the topology of the cores on the VM. This includes understanding the number of physical CPUs, which CPU each core maps to, and what physical CPU is handling the network traffic. The T2A-Standard-16 has 1 physical processor, with 16 cores. This is much more relevant on the C2 and T2D VM families.
Pin Pelikan threads to specific cores, keeping the core topology in mind. With 2 Pelikan processes, consisting of 6 threads each, we had a total of 12 active threads. We pinned each of these 12 threads explicitly to a core to minimize unnecessary context switching. Nevertheless, there was one final source of interrupts that could cause the threads to repeatedly give up their context on a core: network I/O.
Pin receive/transmit (RX/TX) queues to specific cores. As we established, context switches are expensive and signals to handle packets get higher priority than user space threads. The T2A-Standard-16 NIC supports up to 16 receive/transmit queues (1 queue per core), but boots with a default of 8 queues, pinned to the first 8 cores. In our benchmarking, we found that 4 queue pairs were sufficient to keep our Pelikan threads at 95%+ utilization, and we pinned those to their own cores.
Overall, we had 12 Pelikan threads pinned to specific cores, and 4 RX/TX queues pinned to their own cores. We were not bottlenecked on network throughput, or packet processing, giving us confidence that 4 is sufficient.
結果
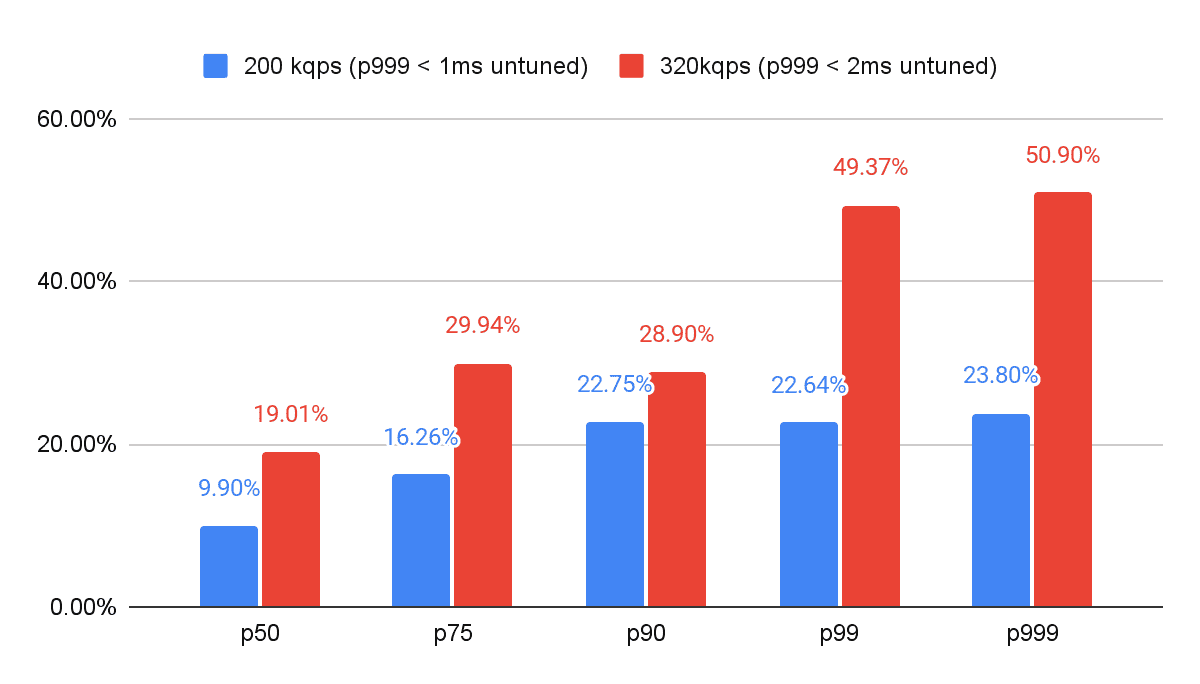
Core pinning enabled us to *triple* the load we could handle within our 2ms p999 SLO. At 320K OPS, we reduced our latencies by 50.8% at p999. Core pinning also enabled the T2A-Standard-16 to outperform the C2-Standard-16.
Isolating the network to its own cores and pinning the active Pelikan threads to their own cores drove better performance. While we are still quantifying the exact impact of context switching, we feel comfortable with the efficacy of our core pinning due to the impact on throughput and can validate our first hypothesis.
The impact of core pinning was more prominent at higher loads (Hypothesis 2), but we saw a meaningful (23%+) impact on p999 even at 200K OPS. At 320K OPS, core pinning dropped p999 latencies by over 50%.
The ROI on this type of effort was minimal on p50 latencies, with only 10% reduction in latencies at 200K OPS. If one is hyper focused on average or p50 latencies, it may be tempting to undervalue these investments. On the other hand, for those of us who appreciate the importance of tail latencies enough to measure, report, and optimize it, this exercise has a very high ROI with 50% reduction in p999 latencies at high loads.
Latency reduction from tuning

Best of all, our techniques had a similar impact on x86-based C2 VMs as well, albeit slightly less dramatic. Core pinning gave us 3x throughput improvement on our 2ms p999 SLO on the Arm-based T2A VMs, compared to 2.7x on x86 based C2 VMs.
The C2 did outperform T2A without core pinning by 35% (460K vs 340K OPS)! However, after core pinning on both, the T2A breached the 1M OPS threshold, while the C2 instance peaked at 950K OPS. In other words, core pinning alone made the difference between outperforming x86 for our 2ms p999 SLO.
Impact of tuning on redline

Conclusion
It has been exciting to partner with Google Cloud on all these optimizations to deliver the world’s fastest cache. We are just getting started on our tuning—and we expect to continue optimizing cost and performance on behalf of our customers!


